Easily Perform Static Code Analysis with Qodana

What is Qodana?
Qodana is a code quality improvement tool provided by JetBrains. It is very easy to use, so I would like to introduce it briefly.
First, you need an environment with Docker installed.
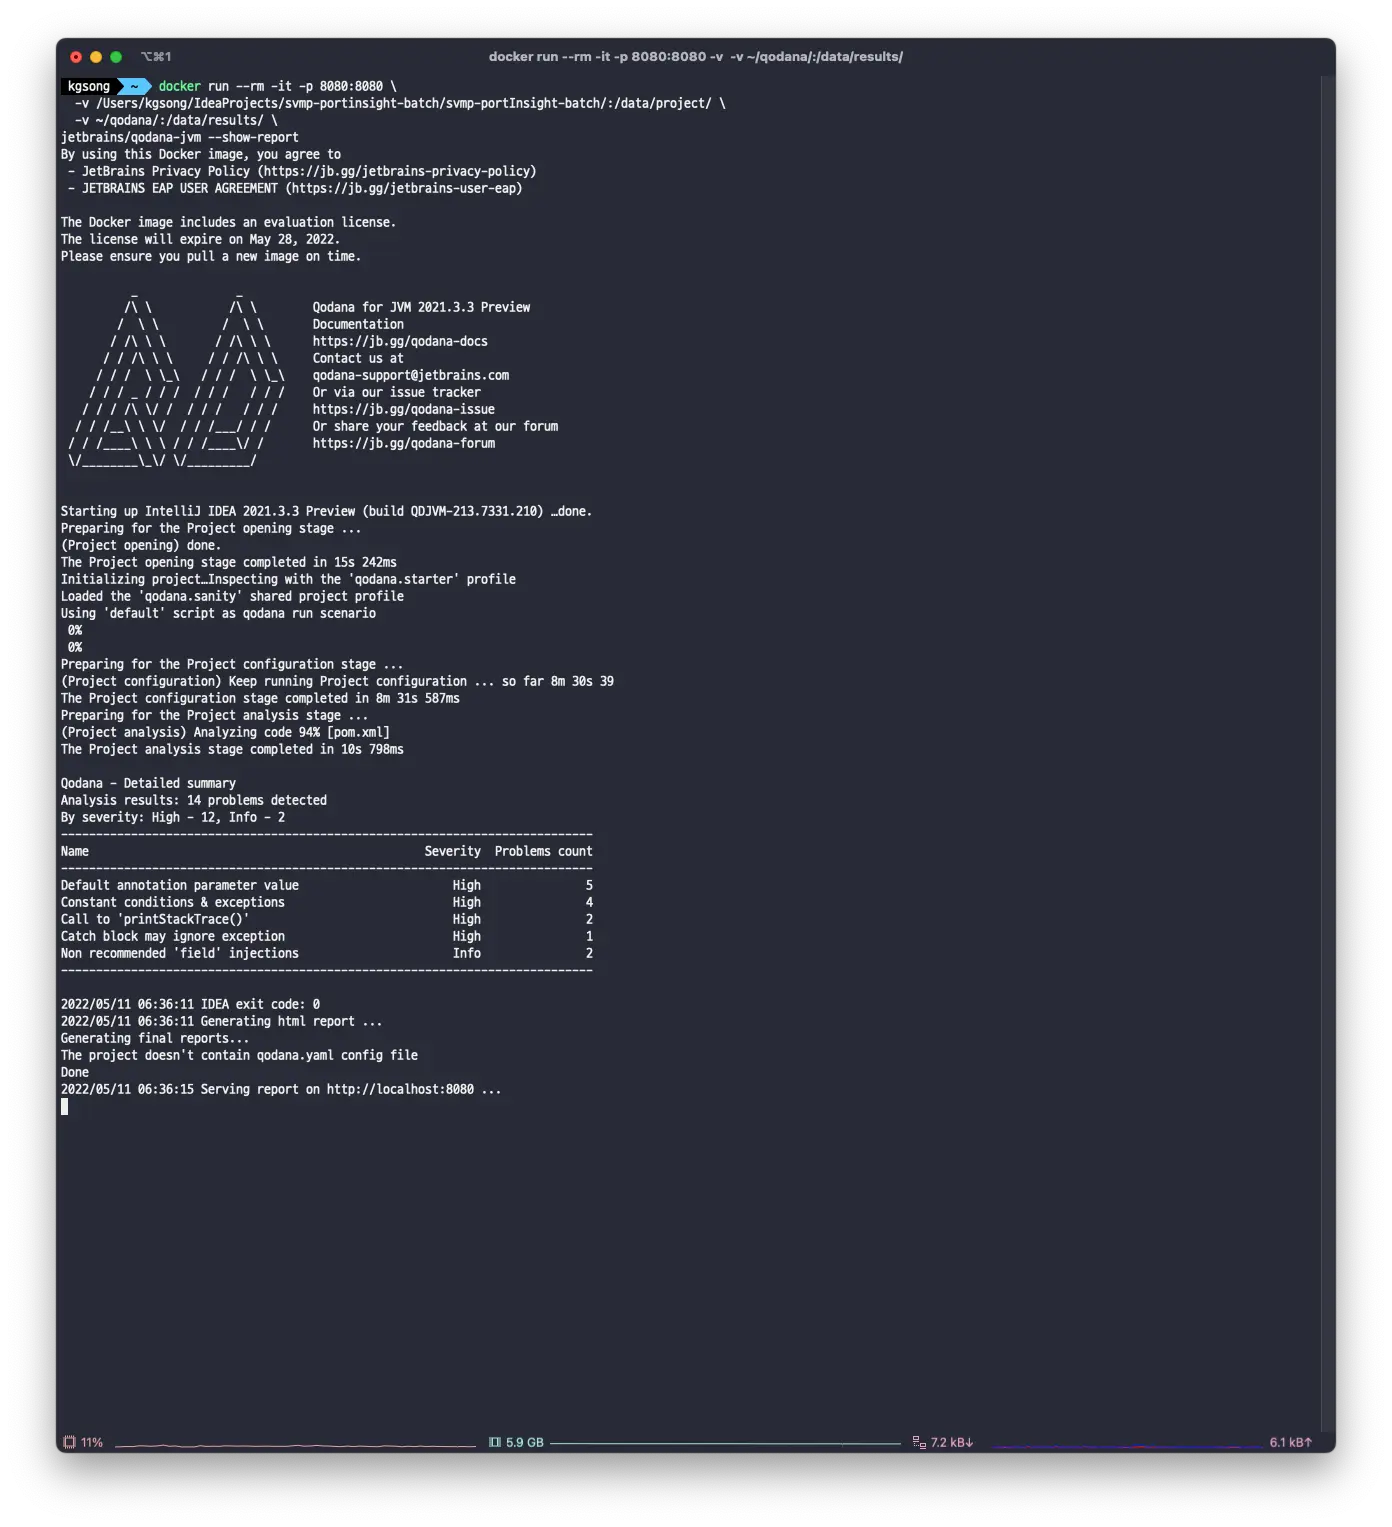
docker run --rm -it -p 8080:8080 \
  -v <source-directory>/:/data/project/ \
  -v <output-directory>/:/data/results/ \
jetbrains/qodana-jvm --show-report
I am analyzing a Java application, so I used the jvm image. If you are using a different language, you can find the appropriate image on Qodana's website.
- Replace
<source-directory>with the path to the project you want to analyze. - Enter the path where the analysis results will be stored in
<output-directory>. I will explain this further below.
To store the analysis results, I created a folder named qodana in the root directory.
mkdir ~/qodana
# Then replace <output-directory> with ~/qobana.
Now, execute the docker run ~ command written above and wait for a while to see the results as shown below.
I used a simple Java application for testing.
Now, if you access http://localhost:8080, you can see the code analysis results.
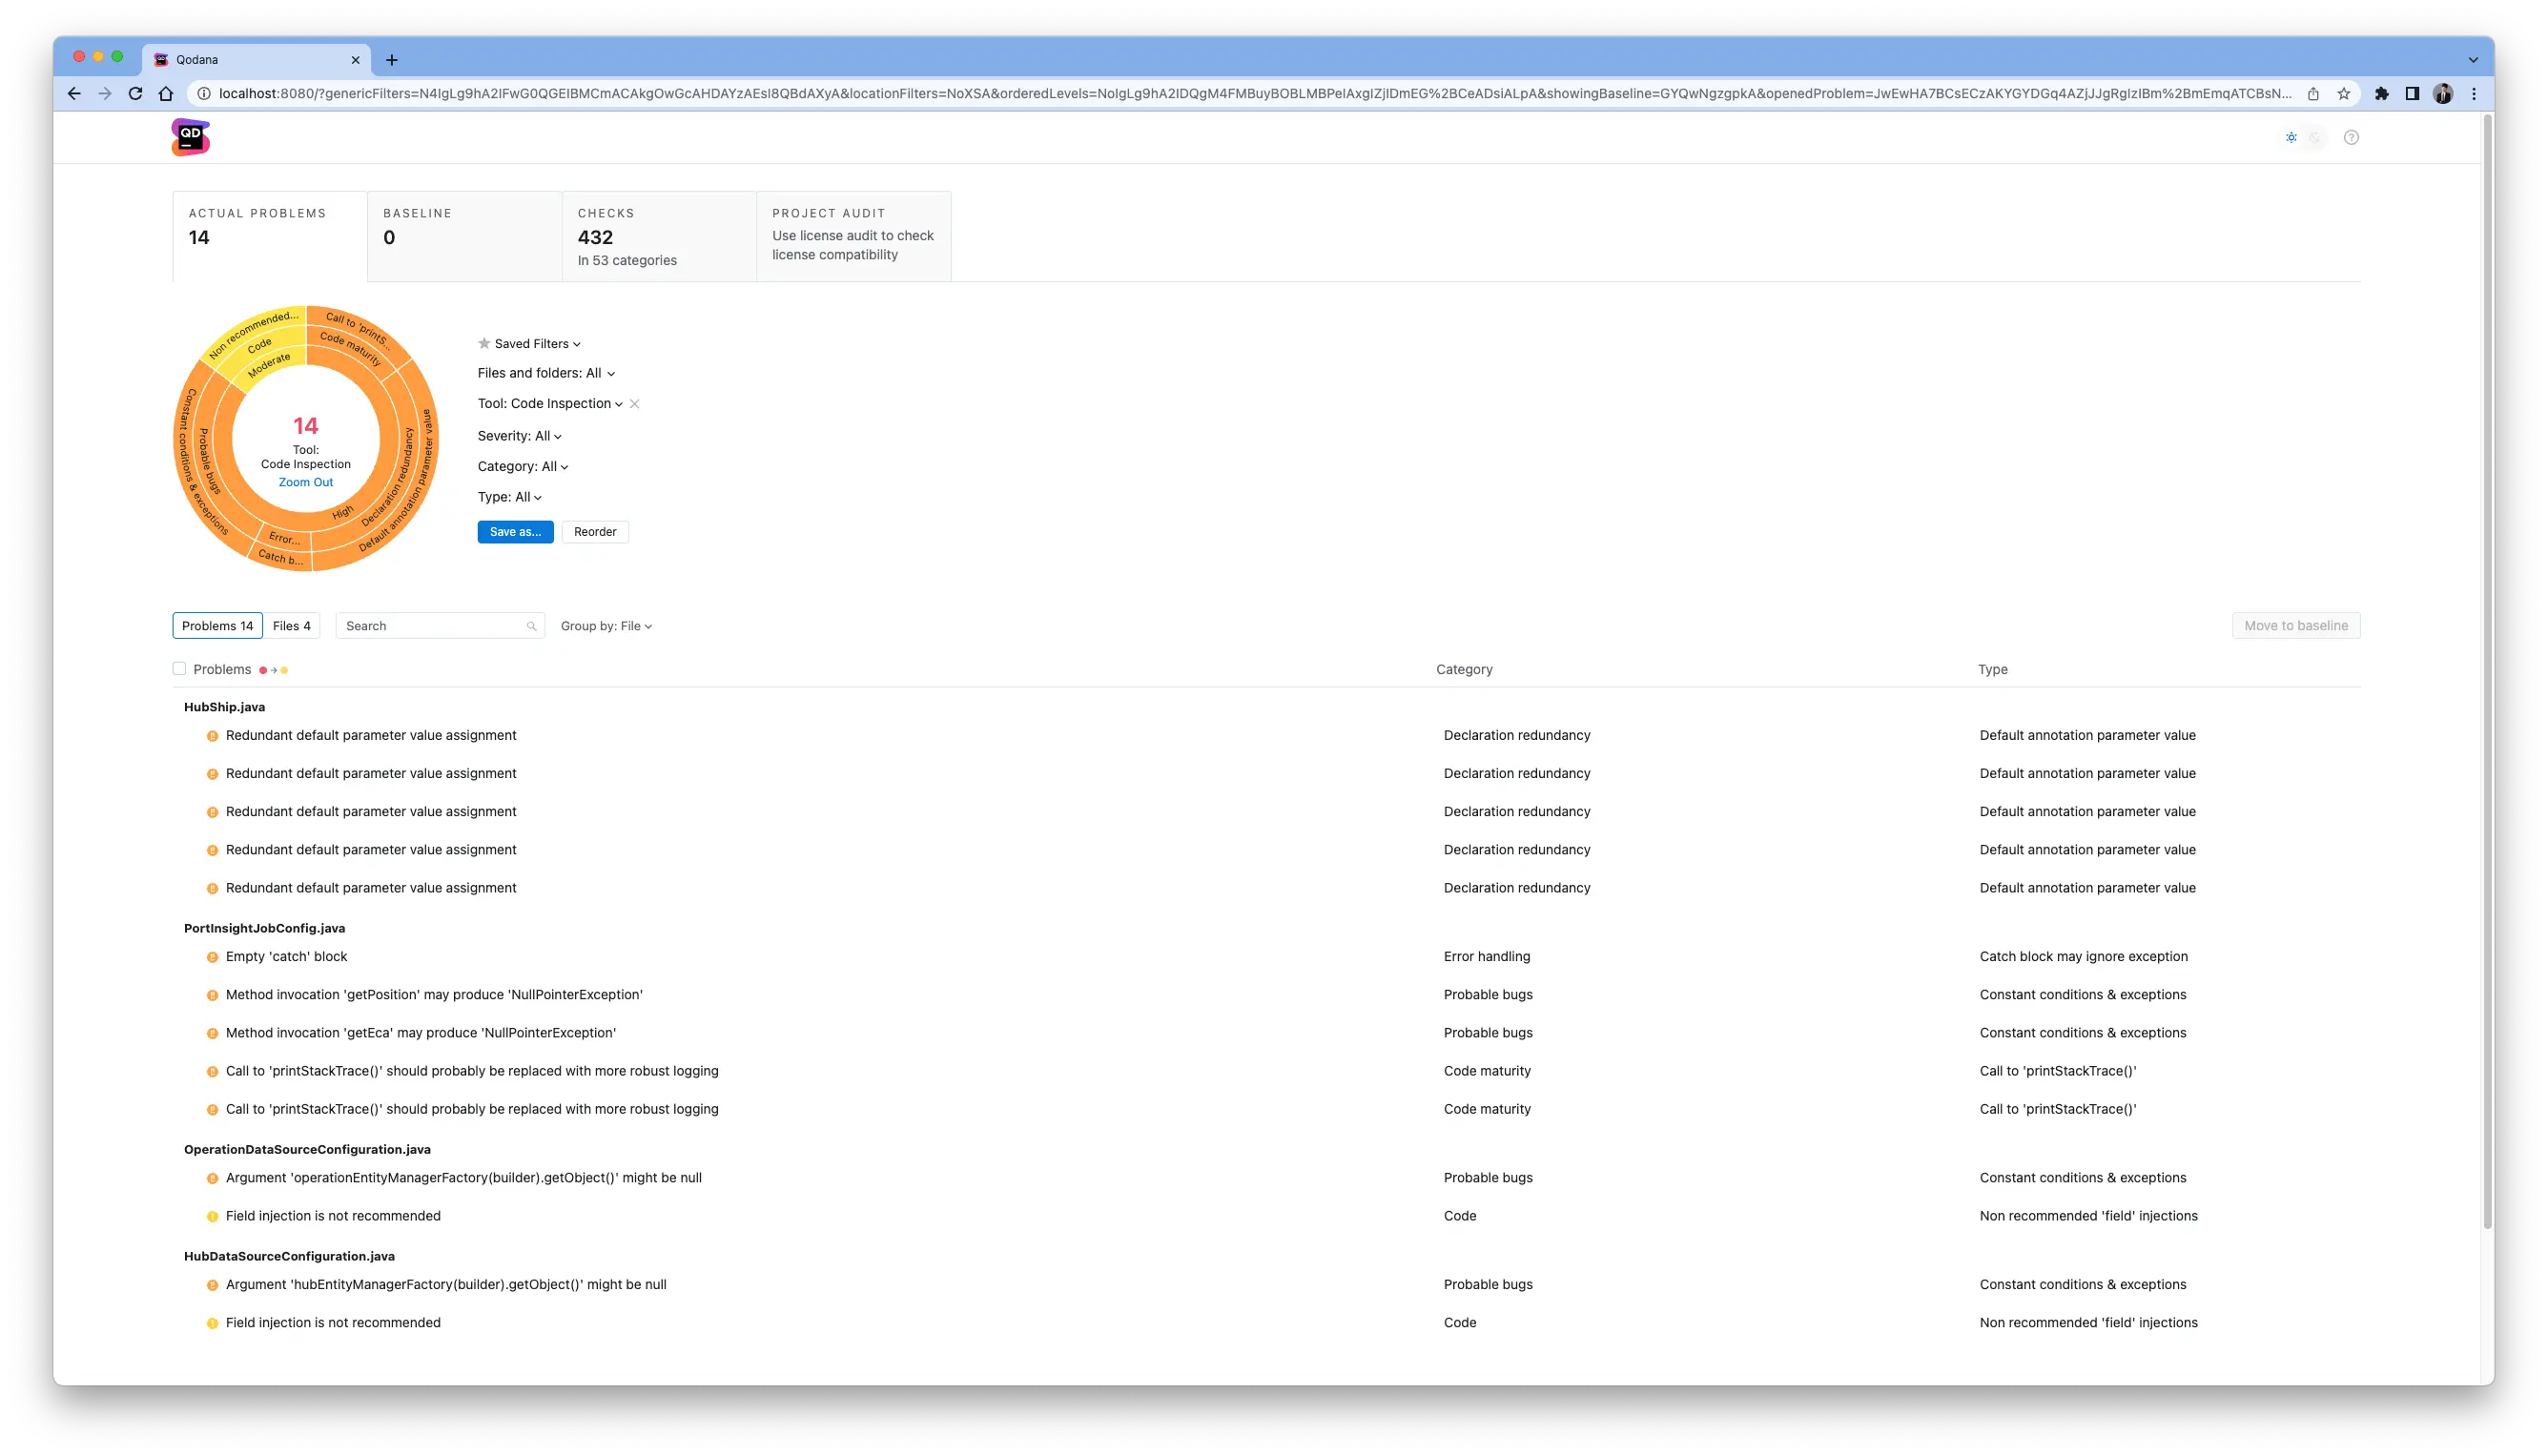
If you have Docker installed, you can easily obtain the code analysis results of your current project.
Such analysis tools serve as a form of code review, reducing the reviewer's fatigue and allowing them to focus on more detailed reviews. Actively utilizing code quality management tools like this can lead to a very convenient development experience.